
We had this installed in late November 2013 by A Shade Greener at absolutely no cost to us whatsoever, and have found the company as good as their word at every stage. They get the ‘Feed In Tariff’ for all the electricity generated. We get to use as much of the electricity generated that we can for free, with the rest feeding into the grid. The onus is on us to organise our household and activities to gain the optimum benefit, but the bottom line is that we gain some benefit every time the panels produce anything (there are always appliances such as fridges/freezers, and things on standby, using some electricity). We will always have an electricity bill for what we use over and above what the panels produce at a given time – and through the night of course!
A few things need to be taken account of before looking at the figures.
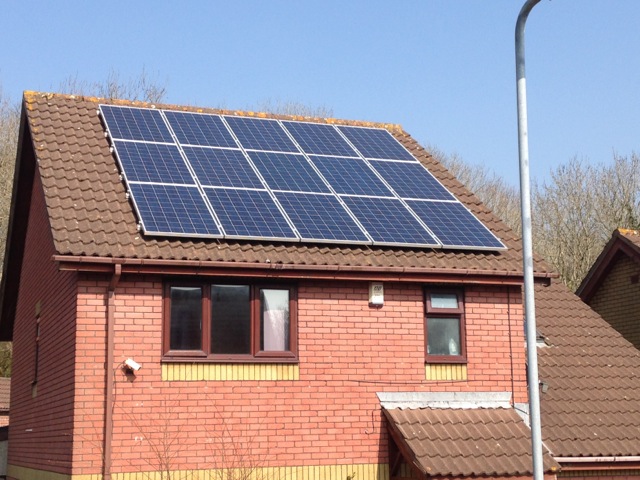
- This is a maximum size installation of 4kWp, using slightly bigger than usual panels.
- Our house faces a bearing of 210 degrees, which is 30 degrees off the due South which gives optimum performance.
- The company will consider installations up to 45 degrees either side of due south i.e. anywhere between bearings of 135 (SE) and 225 (SW) degrees.

SO, WHAT SAVINGS HAVE WE MADE?
The data comes from our eco-eye monitor, which cost us £60. This is the only outlay we have made, as A Shade Greener don’t supply one (it makes no odds to them whether we use the electricity produced or not), but I would say it is very worthwhile as it flags up when there is surplus electricity available for us to use – time to put the washing machine or dishwasher on – and also provides the data below (and masses more):
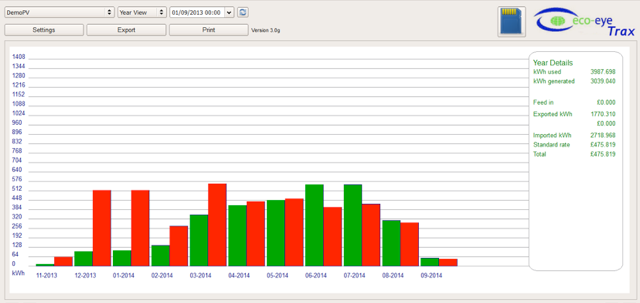
(I had hoped to show the whole of 2014, but the memory card became full in early September, so ignore the incomplete months of Nov “13 and Sep “14)
The graph indicates the electricity we used in red and the electricity generated by the panels in green.
I am puzzled why we used so little in February last year, but otherwise the pattern is much as may be expected. We find:
- Peak consumption in Dec/Jan/March; lowest consumption in (bar odd data for Feb) in Jun/Jul/Aug
- Peak production was in Jul/Jun/May; with lowest production in Dec/Jan/Feb
- Production actually exceeded consumption in Ju/Jul/Aug
However, there is always a mismatch between times of production and times of consumption, so how does this pan out?
Of the 3039kWh generated by the panels, we exported 1770kWh, so we used 1269kwh of it (42%). Had we managed to use all 3039kWh, this would not have covered all of our consumption – but would have covered 76% of it.
Over the period, the house used 3988kWh, importing 2710kWh of it (68%), so we have a headline figure of 32% saving – just below the 37% average saving cited by A Shade Greener:

In monetary terms, it depends what unit rate you are paying. We currently pay 14.04p per unit to Ecotricity.
The 1269kWh we got from the panels was therefore worth about £178, but this excluded Sep/Oct/Nov. If we assume these would have been average months, the annual saving would be around the £235 mark.
There is plenty more we could do to optimise our use of the panels’ production, but we are getting worthwhile savings and also passing our surplus into the grid, reducing the need for non-renewable production.
It really is a no-brainer!
P.S. If you call A Shade Greener in, don’t forget to mention my name!

I’ve got them on my roof too. We have what I would call a “South South West” roof.
Never looked back.
LikeLike